Power BI

Automated Financial and Management Reports
We design solutions that automate the reporting and data analysis process, supporting businesses in managing large amounts of information.
Use standard reports based on accounting data available to our clients with the Microsoft Dynamics 365 Business Central accounting system, or request custom reports that integrate data from multiple sources.
Learn more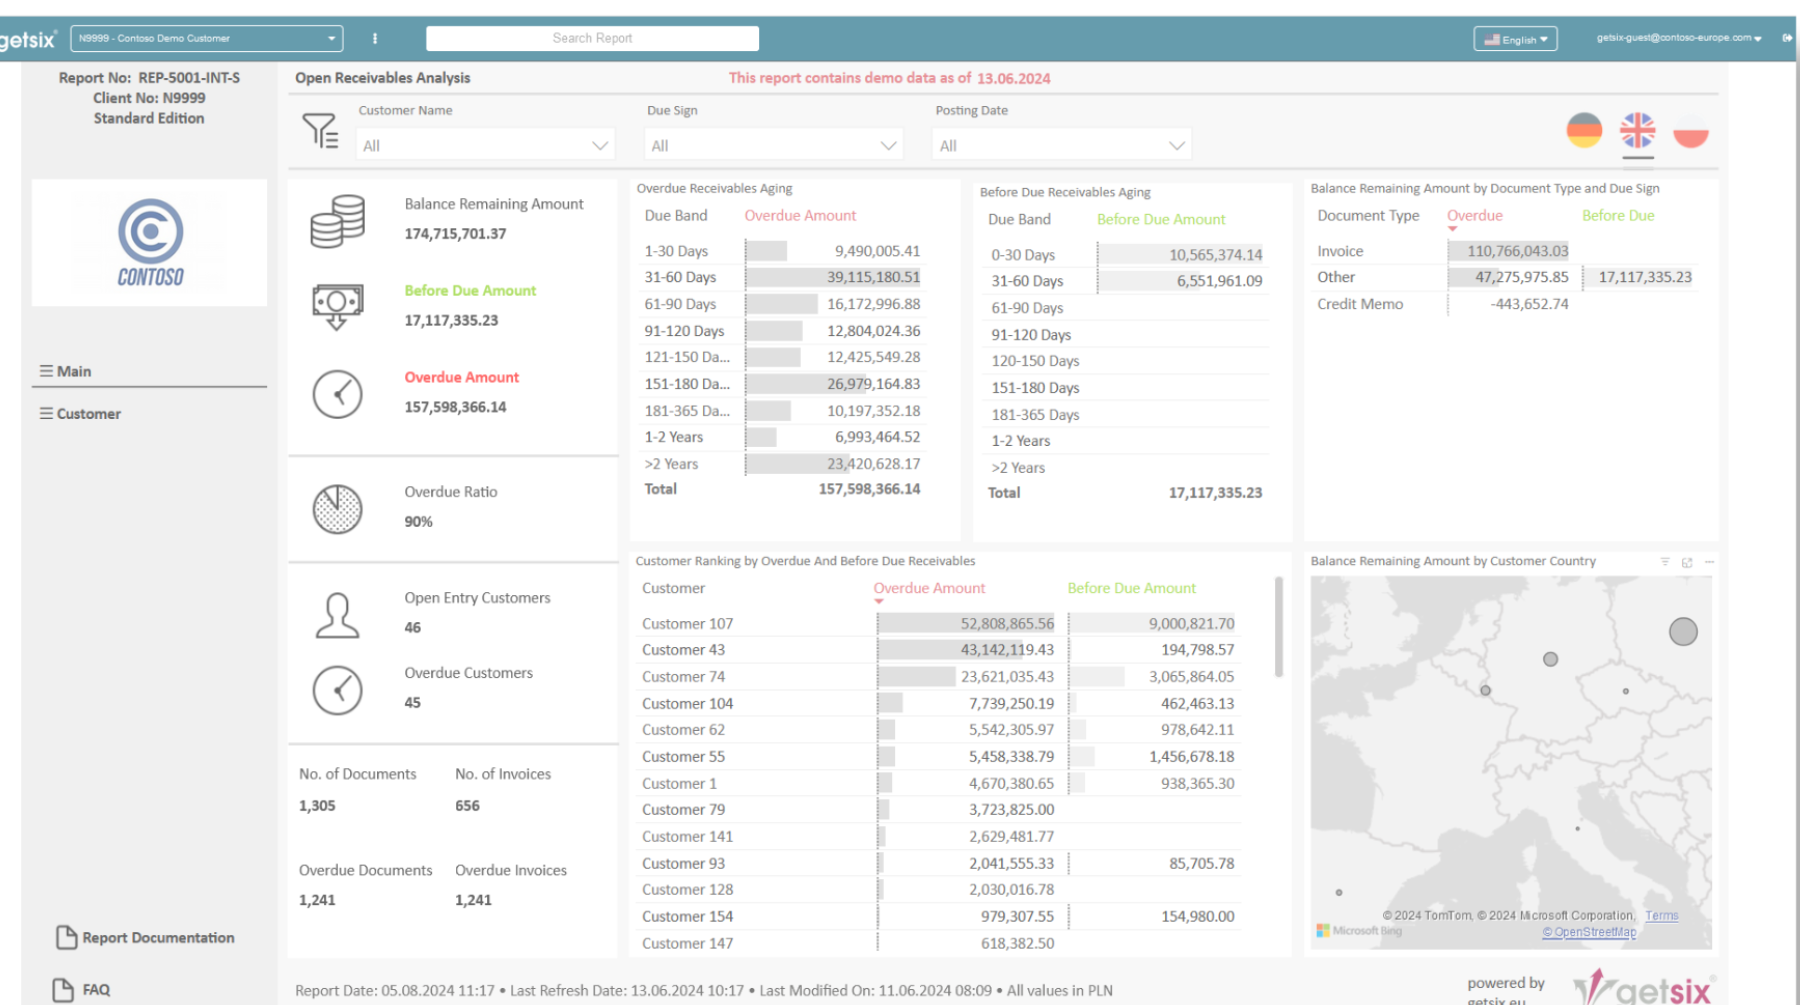

Manage Your Organization Through Financial Data Analysis
Power BI is an advanced analytics tool that revolutionizes data management in enterprises by combining information from various sources into a cohesive whole. With attractive visualizations and seamless integration with diverse systems, Power BI enables rapid data analysis, supporting informed business decision-making.
Contact UsWhy Choose Microsoft Power BI?
Our business analytics solution provides interactive
dashboards and insightful
reports directly connected to your ERP system.
4 Key Benefits of Implementing Power BI in a Small Business

Quick Access to Key Data in One Place
Power BI allows you to connect various data sources – from Excel, through accounting systems, to CRM – and presents them in the form of clear dashboards. The owner or manager has access to current information in real-time, without the need to involve the IT department.
Better Decisions Through Data Analysis
Even simple data visualizations show trends, dependencies, and risks that are difficult to notice with the "naked eye." This allows small businesses to make more accurate business decisions – for example, in terms of costs, sales, margins, or employee efficiency.


Time Savings
and Reporting Automation
Instead of spending hours creating reports in Excel, Power BI enables their automatic generation and updating. Once prepared reports refresh themselves – saving team time and eliminating human errors.
Scalability and Low
Entry Costs
Power BI is a cloud solution that can be implemented gradually, without large initial investments. A small business can start with the basic version, and as the business develops – expand the system with new data sources and reports.

Schedule a Free Consultation
If you're unsure which solution to choose, schedule a free consultation with our expert.
We'll help match the most effective solutions to your company's individual needs.
Contact UsOUR BUSINESS INTELLIGENCE
SOLUTION EXPERT

Yurii
Business Intelligence Analyst
IT Solutions Department Wrocław
![]()
![]()
![]()
Microsoft Certified:
Power BI Data Analyst Associate
Certification number:
3D44D8-CA64F6
Fabric Analytics Engineer Associate
Certification number:
13737C-C5CV3E

Precise Financial Analysis and Reports for Your Business
Financial Reports
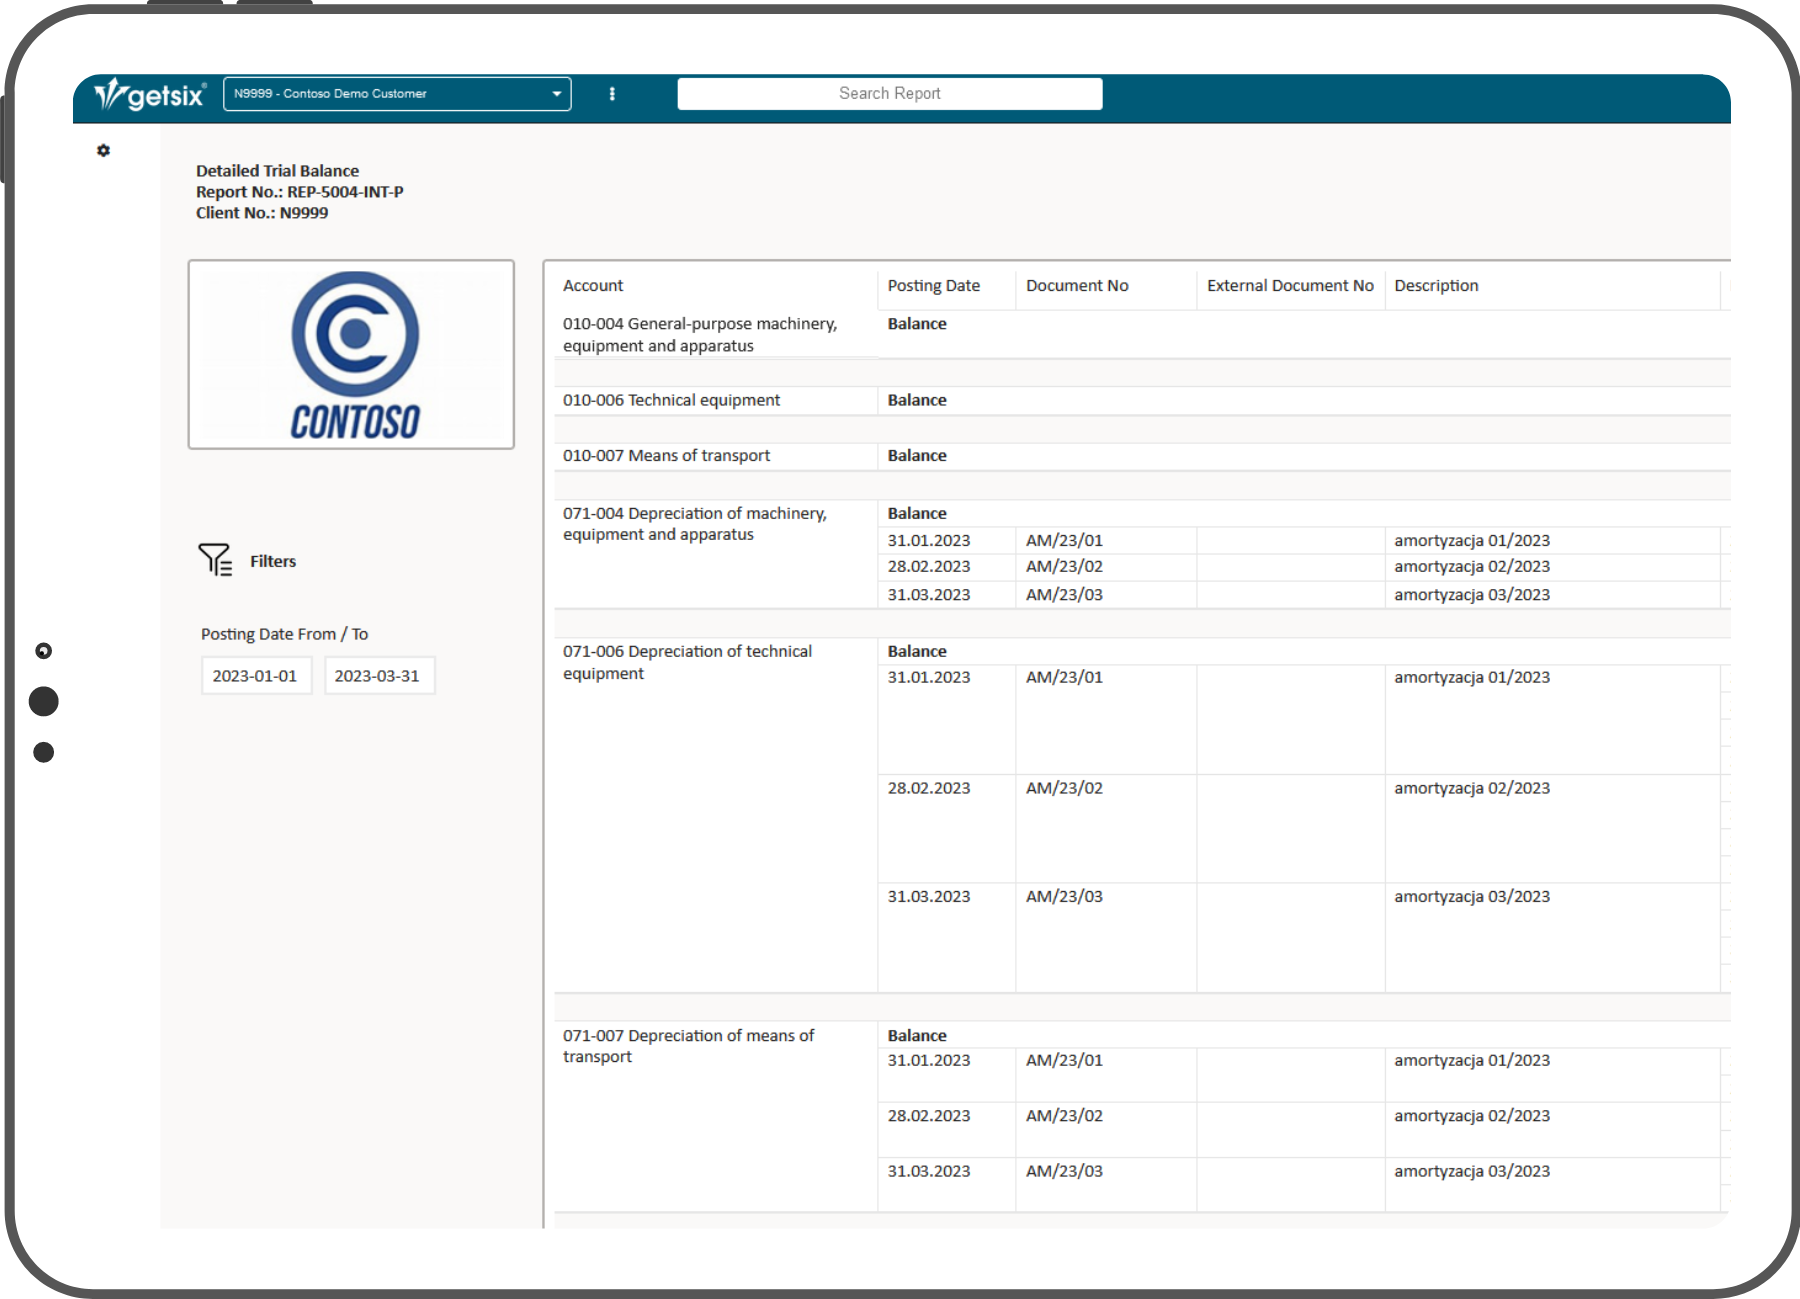
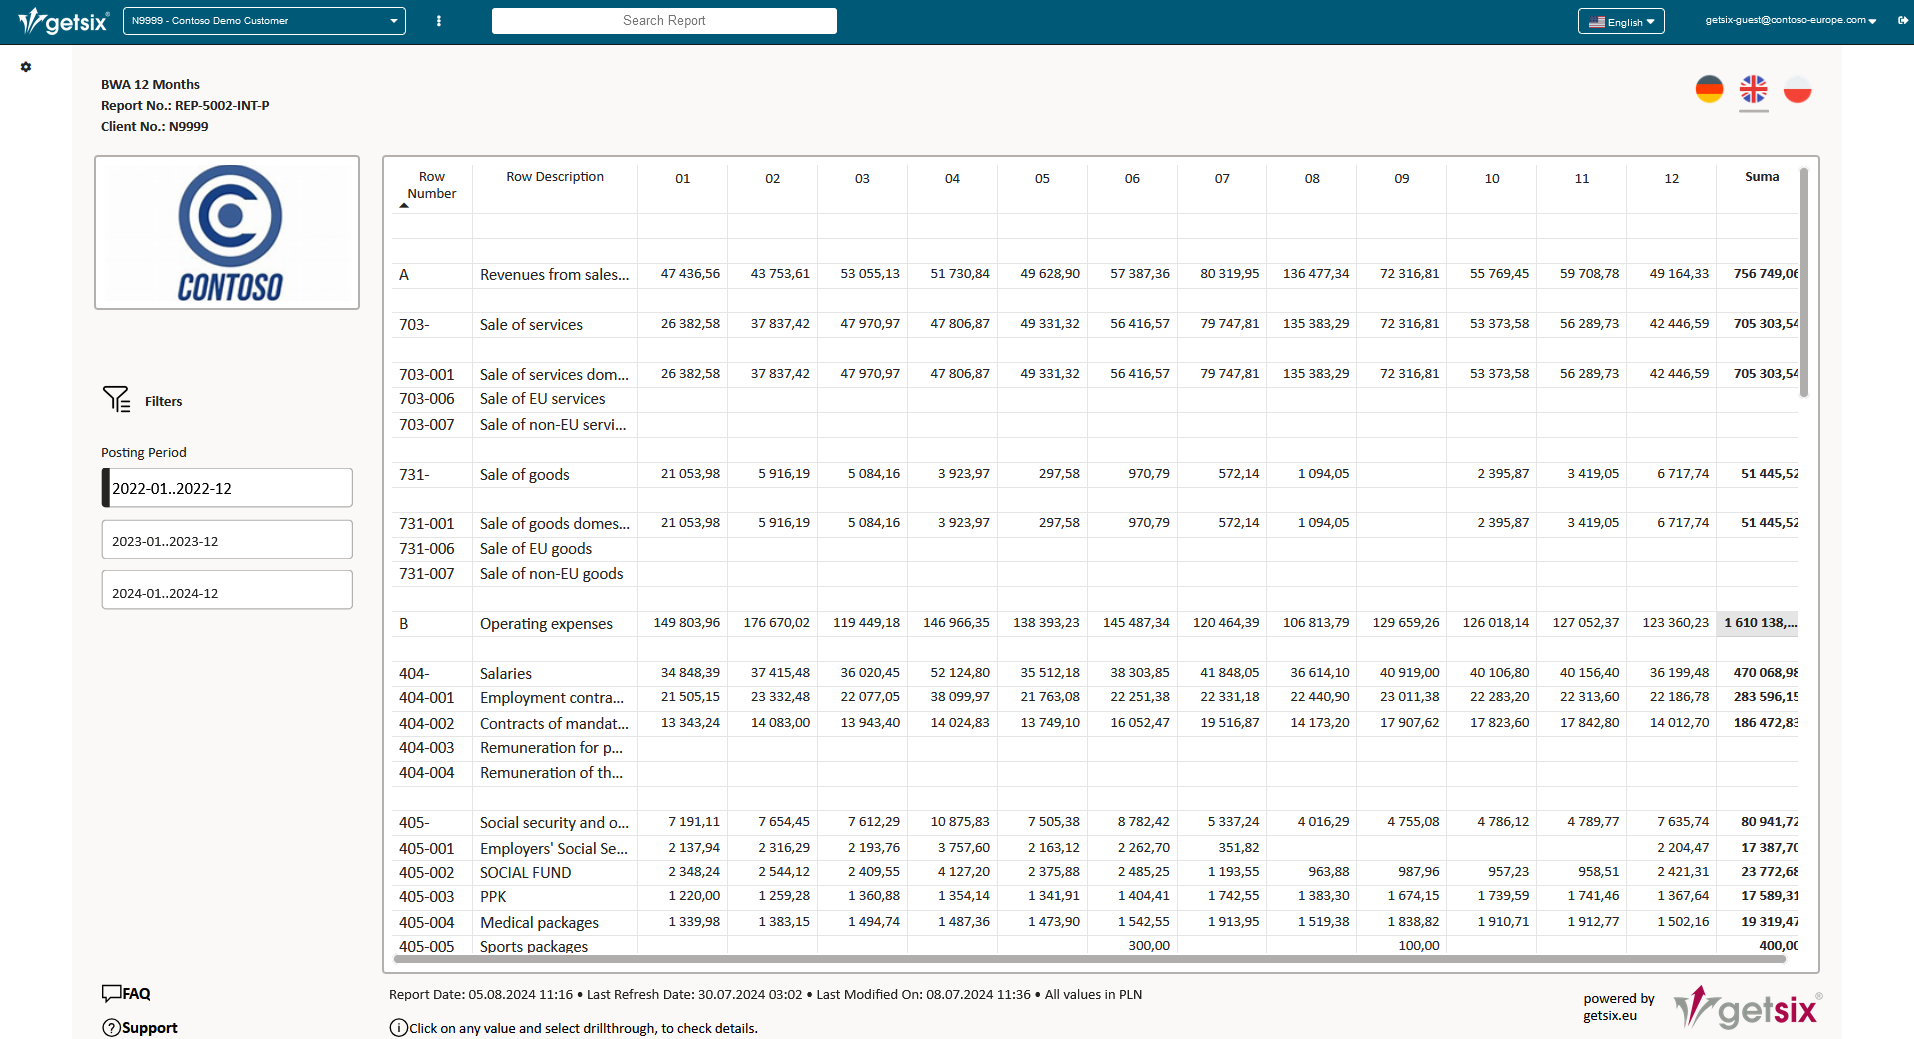
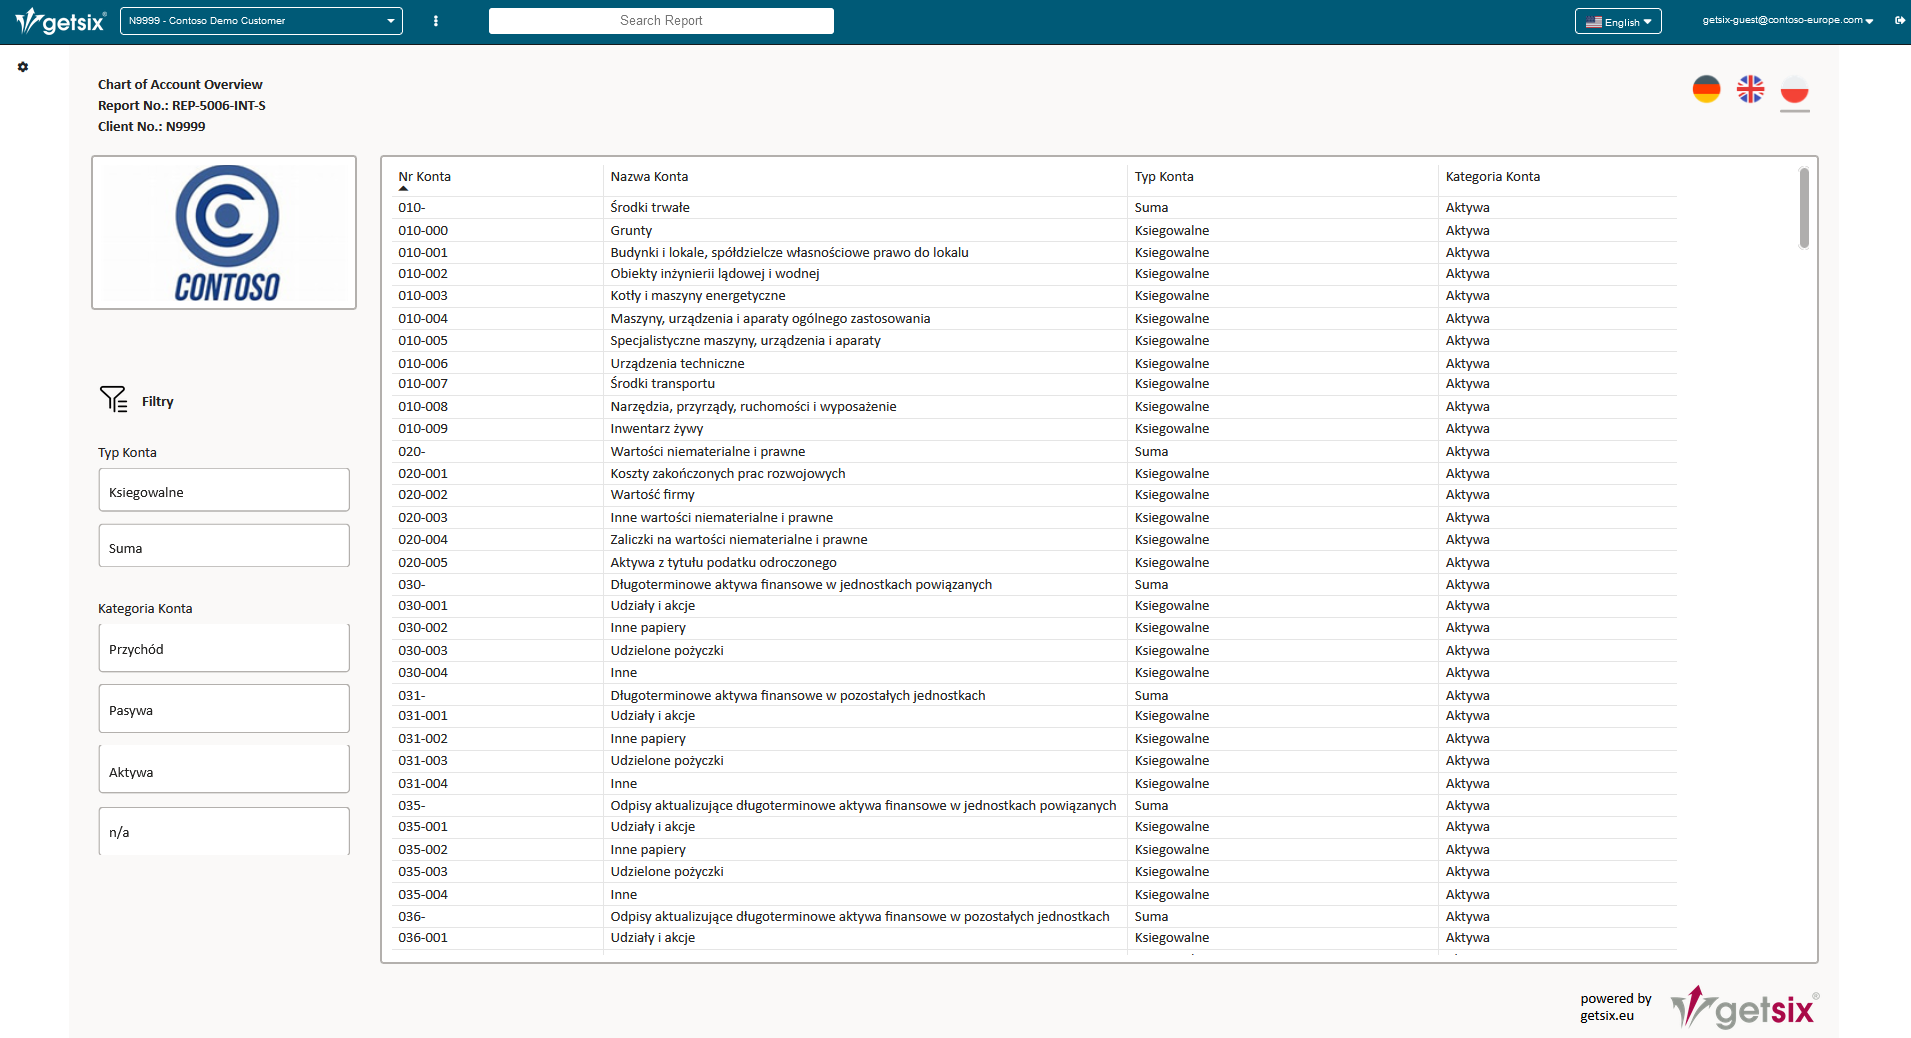
Financial reports and analytics are key elements supporting financial management and decision-making processes in enterprises. They enable detailed monitoring of financial results, analysis of costs, revenues and profits, as well as forecasting future trends. This allows companies to plan budgets more effectively, optimize resource allocation, and minimize financial risk.
When implementing Power BI, it's worth considering the implementation of Microsoft Dynamics 365 Business Central accounting system. Combining these two solutions allows for full utilization of analytical potential in managing company finances and operations. With Microsoft Dynamics 365 Business Central implementation and standard chart of accounts, you gain the ability to quickly implement key Business Intelligence (BI) reports.


See how your financial reporting dashboard can look
DEMO

Management Reports
Management reports created using Business Intelligence (BI) tools provide essential support for management teams, enabling real-time monitoring of key performance indicators.
The use of management reports provides managers with deeper insights into company performance, enabling faster and more effective data analysis, identification of key trends, and precise evaluation of business results. Management reports support better resource management, minimize risk, and increase the effectiveness of achieving organizational strategic goals.
Example data sources for reports:
- ACCOUNTING AND INVOICING SYSTEMS
- WAREHOUSE DATA
- PAYMENT GATEWAYS
- MARKETPLACES, E-COMMERCE STORES
- MARKETING DATA
- CRM, ERP, HR SYSTEMS etc.
How Does the Implementation Process Work?
The implementation of our business support solutions is carried out with the support of a Microsoft Certified: Power BI Data Analyst Associate, guaranteeing the highest quality of service.
Describe your needs via email or by filling out our contact form.
We'll schedule a consultation meeting to discuss possible solutions and data sources.
Schedule a meeting
Based on the submitted order form, we'll prepare a service implementation quote.
After project approval, we'll begin implementation, and upon completion, we'll conduct a satisfaction survey of the implemented solution.


Management control and performance comparison of multiple companies operating in different countries.
Client: A forestry company for which we have been providing reporting services in Poland since 2015, and accounting services as getsix. From the beginning of our collaboration, the management team placed great emphasis on an effective reporting system that enables management control and comparison of financial results of companies operating in different European countries.
Sector: Forestry industry
Competencies:
- Implementation of Microsoft Dynamics 365 Business Central (modules: Finance, Reporting, Analytics)
- Integration with Power BI
- Integration with getsix® Customer Extranet
- Automation of management reporting processes
- Scalability and customization of the reporting system
Business Need: The company manages several entities operating in different European countries, which involves the need to compare financial results, analyze costs, and implement management control at the capital group level.
The previous reporting system was based on spreadsheets that required manual data entry and sending reports once a month. This process was time-consuming and error-prone, which limited the ability to make quick management decisions and made it difficult to compare financial results between companies.
The management team needed a comprehensive solution that would not only automate the reporting process but also provide ongoing access to current financial data, enabling more effective management control and comparison of business results at the international level.
Developed Solutions: To meet the client's business needs, we implemented an integrated reporting system based on Microsoft Dynamics 365 Business Central and Power BI. This solution allows for automatic retrieval of current financial data from the ERP system and generation of advanced management reports in real-time.
These reports include analysis of costs, revenues, assets, and liabilities, as well as comparison of financial results between individual companies in the capital group. Using Power BI, the management team has access to interactive dashboards that enable in-depth data analysis and monitoring of key financial indicators.
Additionally, getsix® Customer Extranet was implemented, which enables secure exchange of documents and financial reports between branches in different countries. As a result, the client gained full control over the flow of information and the ability to quickly access current data from anywhere in the world.
The new reporting system replaced the previous spreadsheet, eliminating the need for manual data entry and automating the process of generating management reports. As a result, the time needed to prepare reports was reduced by 50%, and the analysis of financial results became more precise and reliable.
Development of a management dashboard for logistics KPIs in the warehouse process using Power BI
Client: Since 2019, we have been working with a logistics company in Poland, providing data analysis and reporting services, and as getsix, also accounting services. From the beginning of our collaboration, the company expressed the need for advanced tools to monitor and optimize warehouse processes to better manage logistics operations and improve the efficiency of goods flow.
Sector: Logistics and warehouse management
Competencies: Power BI, Microsoft Dynamics 365 Supply Chain Management, getsix® Customer Extranet
Business Need: The logistics company managed many warehouse processes, such as order picking, inventory management, delivery timeliness, and employee performance control. Before implementing an advanced reporting system, the company struggled with limitations in operational control, resulting from the use of outdated reporting tools based on spreadsheets.
The lack of current access to operational data and the time-consuming process of preparing reports limited the ability to quickly respond to market changes and identify inefficiencies in warehouse processes. The company's management needed a more advanced tool that would enable monitoring of key logistics indicators in real-time, comparing operational efficiency between different warehouses and logistics departments, as well as improving the decision-making process based on accurate and current data.
This dashboard was to be used at morning manager meetings to analyze the main indicators of the logistics process and identify areas requiring optimization, which would ultimately lead to increased operational efficiency and reduced logistics costs.
Developed Solutions: As part of the project, we implemented an advanced management dashboard in Power BI that integrates data from various warehouse and logistics systems, such as Microsoft Dynamics 365 Supply Chain Management and the client's internal warehouse management systems. Integration with getsix® Customer Extranet enabled secure exchange of data and reports between operational departments and management, which contributed to improved communication and operational efficiency.
The dashboard was designed to provide a complete picture of warehouse processes and enable ongoing monitoring of key performance indicators (KPIs). Thanks to advanced analytics in Power BI, data was processed in real-time, allowing for ongoing tracking of operational changes and identification of areas requiring optimization.
With the intuitive Power BI interface, users could independently explore data and create their own analyses, which significantly increased the efficiency of warehouse operations management and streamlined the decision-making process.
Would you like to know how much it would cost to implement Power BI in your organisation? We will prepare a quote tailored to your needs – with no obligation.
FAQ
How do you find the right Power BI service provider?
When choosing a Power BI provider, it's worth betting on an experienced company with a team of experts. Check out reviews from other clients and arrange a meeting to discuss how specific solutions can improve the efficiency of your business.
How do you choose the right business intelligence tool for your business?
When choosing a business intelligence tool, it is worth paying attention to aspects such as integration with existing systems (e.g. Microsoft Dynamics 365), intuitiveness of use, scalability of the solution and its performance and security. Power BI meets these requirements, offering a wide range of analytical functions, flexibility and ease of use.
What are the costs of implementing Power BI?
The costs of implementing Power BI depend on the scope of functionality, number of users and personalisation needs. Basic costs include the purchase of a licence, system configuration and any training. The ability to scale the service allows costs to be tailored to the company's budget.
Why choose Power BI as an analytical tool?
Power BI is distinguished by its ease of use, ability to integrate with multiple data sources and extensive visualisation and analysis functionality. The tool supports the decision-making process by enabling the creation of interactive reports and dashboards in real time.
What data can be analysed using Power BI?
Power BI enables analysis of a wide range of data that can support key areas of business operations. Specifically:
- Financial Reports: Power BI allows monitoring of financial results, analysis of costs, revenues and profits, as well as forecasting future trends. Through integration with accounting systems like Microsoft Dynamics 365 Business Central, you can gain detailed insight into your company's financial situation and manage budgets more effectively.
- Management Reports: The tool supports management in analyzing key performance indicators, identifying trends, and evaluating business results. This enables managers to make faster and more precise strategic decisions.
- Data Sources: Power BI can integrate with multiple systems such as accounting systems, CRM, ERP, warehouse data, payment gateways, marketplaces, and marketing platforms. This allows creation of comprehensive reports that combine data from various areas of business operations.
How long does it take to implement Power BI?
The process of implementing Power BI can be quick and efficient, especially when using predefined report templates and dashboards. Depending on the company's specific requirements, the entire process can take from a few days to several weeks. Implementation includes configuration of the tool, integration with existing systems and user training.
Do you need technical knowledge to operate Power BI?
No. Power BI is designed so that even people without advanced technical knowledge can create analyses and reports. An intuitive interface and numerous ready-made templates make the tool easy to use.
What are the benefits of implementing Power BI in a company?
Power BI supports the optimisation of business processes, accelerates decision-making through real-time analysis, and improves data transparency. The tool helps create effective business strategies and anticipate potential problems, resulting in greater business efficiency.
Can Power BI be integrated with other systems?
Yes, Power BI allows you to integrate with many systems, such as Microsoft Dynamics 365, Excel, SharePoint, or ERP and CRM systems. This allows you to combine data from different sources and create comprehensive reports.
Schedule a Free Consultation
We encourage you to schedule a free consultation, during which our specialist will help determine the best solutions for your company and present the benefits of implementing the Microsoft Dynamics 365 Business Central accounting system.
Contact Us
Chief IT Solutions Manager
sebastian.mozejko@getsix.pl